
VO₂max and cardiopulmonary exercise testing in Leichhardt
A lab-grade test of what your heart, lungs and muscles actually do with oxygen — then translated into the paces, watts and heart rates you train at.
From $400 · allow 1 hour · full report and interpretation emailed the same day
Measured, not estimated
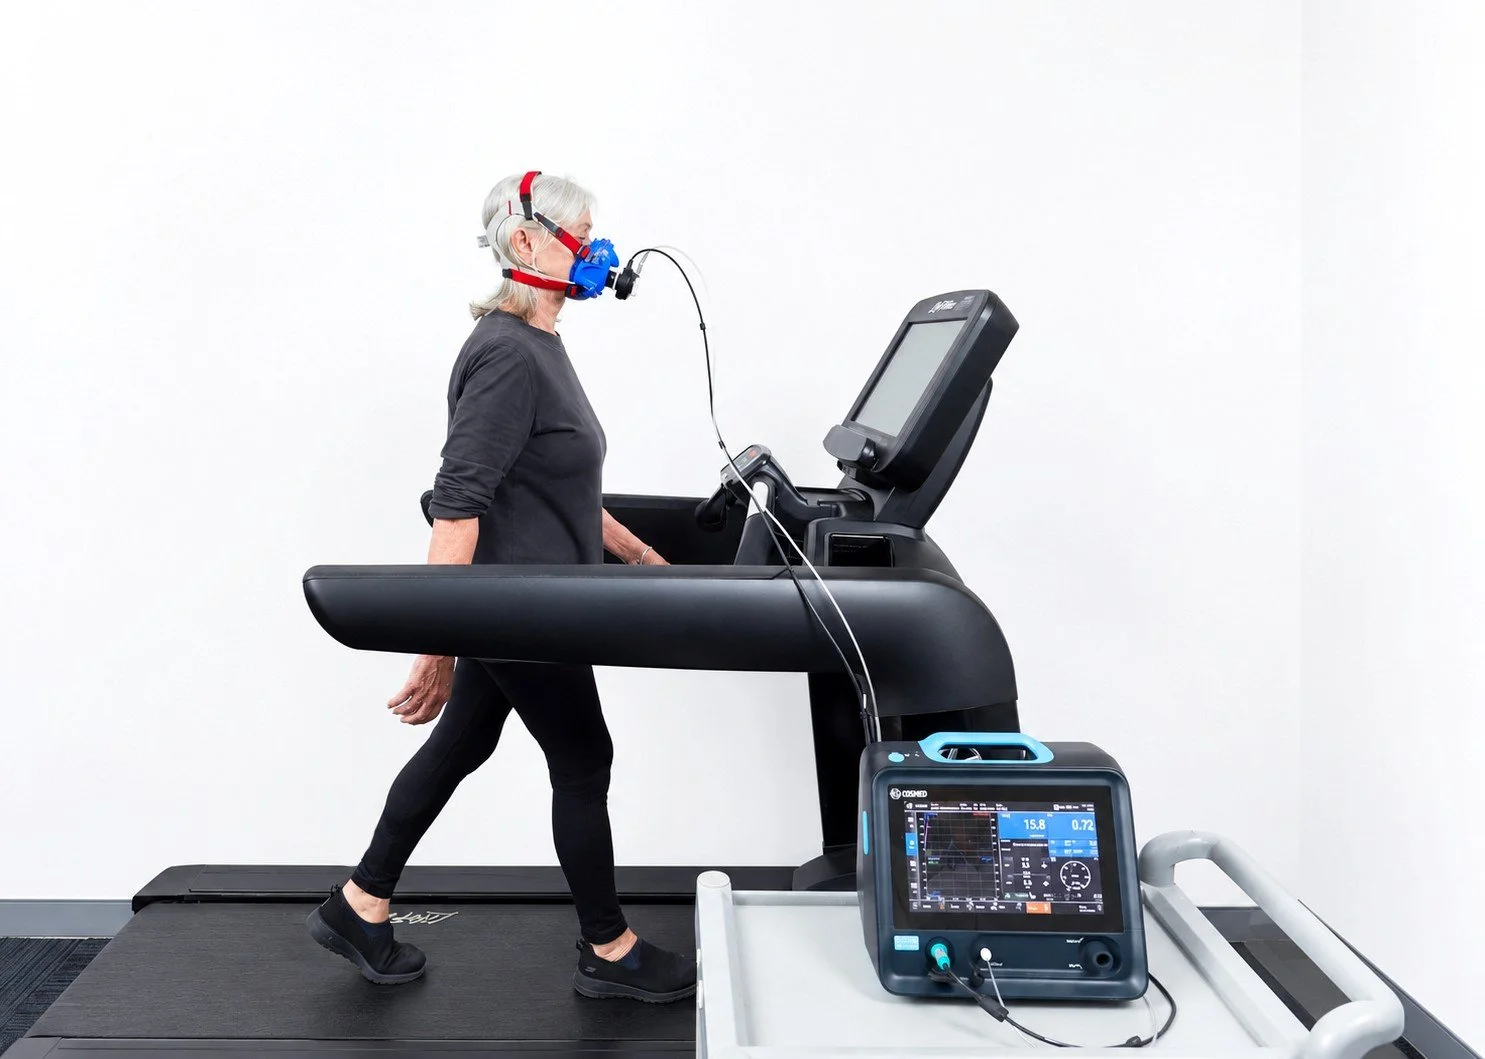
Breath-by-breath gas analysis on a metabolic cart. Not a watch algorithm or a field test.
Your own thresholds
Ventilatory thresholds identified from your data, not calculated off your age.
Run, ride or row
Tested in the modality you actually train in, so the zones transfer directly.
- Test
- Full CPET with breath-by-breath gas analysis
- Modality
- Treadmill, cycle or rowing ergometer
- Duration
- 10–15 min test, 60 min appointment
- Report
- Same day, plus debrief with Anton Sostaric
- Referral
- Not required. GP and specialist referrals welcome
What you get
The results are the starting point. The value is what we do with them.
Five training zones
Set from your own thresholds, expressed in the paces, watts, splits and RPE you actually train by. Your training zones can be translated to over 1000 different sports and activities
Fuel use at every intensity
Where you shift from fat to carbohydrate, and what that means for pacing and race nutrition.
Where you sit
Your results against normative data for your age and sex, and what is realistic to change.
How your results are interpreted
Measuring VO₂max is the easy part. What separates one report from another is what the numbers are compared against
Compared against the right test
Treadmill testing produces higher values than cycle testing in the same person — about 22% higher, because running uses more muscle. Compare a cycle result against treadmill figures and you understate someone by roughly a full fitness band. Your results are matched to the equipment you actually used.
Compared against current data
We use the 2022 FRIEND reference standards, built from 22,379 exercise tests in healthy adults aged 20 to 89. They replaced earlier editions that report values slightly higher.
Your thresholds, not just your maximum
Most reports tell you what your aerobic threshold is (AKA Zone 2). Yours is also compared against 9,350 published tests by age, sex and equipment, so you find out where it sits relative to other people like you.
Sport-specific where it exists
Rowers are compared against pooled data from 909 rowers by competitive class, and against absolute oxygen uptake — which is what boat speed actually depends on.
VO2max test and report
$400
1 hour
- Full CPET on treadmill, cycle or rowing ergometer
- VO2max, ventilatory thresholds and five training zones
- Substrate utilisation across intensities
- Consult and written report, same day
VO2max and DEXA
$575
90 minutes
- Everything in the VO2max test
- Whole-body DEXA scan and grip strength testing
- Combined consult and training plan
Resting metabolic rate (RMR)
$400
1 hour
- Measured resting energy expenditure by indirect calorimetry
- Fat and carbohydrate use at rest
- Comparison against predicted equations
- Consult and written report
A private health fund rebate may be available under extras cover. The amount depends on your fund, your level of cover and the item billed, so check with your fund before booking.
Resting metabolic rate testing
You lie under a clear canopy for around 20 minutes while the analyser measures the air you breathe out. Measuring gas exchange directly is what makes the result accurate, rather than estimating it from your height, weight and age the way an equation or a smart scale does.
What you burn at rest
Your resting metabolic rate in calories per day — the energy your body uses simply to keep running, before any activity is added.
What you burn it on
The balance of fat and carbohydrate you are oxidising at rest, which reflects how well your metabolism is switching between fuels.
Your own 1 MET value
The multiplier everything else is built from. Activity is costed in METs, so a measured value makes your total daily energy expenditure a calculation rather than an estimate.
That last figure is the one that does the work. With a measured 1 MET value, the energy cost of your training and daily activity can be worked out properly — which makes it possible to plan a change in body fat over a set timeframe with some precision, rather than guessing at a deficit and waiting to see what happens.
Our daily energy planner is built around that number: enter your measured 1 MET value, map your day against the MET Compendium, and it costs the whole 24 hours in calories. You can use it now with an estimate from your DEXA results — a measured value simply makes the output worth trusting.
Before you book
-
Your maximal oxygen uptake (VO₂max), your ventilatory thresholds, and your heart rate at each. Together these describe your aerobic capacity and give you accurate training zones. Also measures fat/carbohydrate oxidation rate, heart rate recovery, breathing reserve and estimated stroke volume.
-
Runners, cyclists, triathletes and team-sport athletes wanting to train with precision, and anyone who wants an objective measure of cardiorespiratory fitness. You don't need to be an elite athlete.
-
You wear a mask connected to a metabolic analyser and exercise on a cycle ergometer / treadmill/rower while the workload increases in stages until you reach your limit. The test itself lasts around 10–15 minutes; allow 60 minutes for the full appointment.
-
You'll complete a pre-exercise health screen when you book. If you have a history of heart, lung or metabolic conditions we may ask for medical clearance before testing. This is a maximal test and you will work hard at the end. We can use a walking test protocol if you prefer. This test involves increasing the treadmill gradient at a constant speed of 4-5km/hr until you reach VO2Max so you don’t need to run in this test. Stationary bike is also a popular choice
-
No hard training for 24 hours, no alcohol for 24 hours, no caffeine for 3 hours, and a light meal 2–3 hours before (can be fasted). Bring running shoes and gear you'd train in. Cyclists can bring their own pedals and shoes if using a cycle ergometer.
-
A report with your VO₂max, thresholds, heart rate and power/pace zones, emailed the same day, plus a debrief with Anton on how to use the zones in your training. Note! This is effectively the first draft of your physiologic training blueprint. It is highly iterative and Anton is available any time for follow up discussion and to help you along your training journey
-
Every 12–16 weeks fits most training blocks — long enough to see a change, short enough to adjust your zones before they drift. The first retest is to validate your exercise program and recalibrate your training zones. Outcome measures such as RPE and pace/watts are easy to report between tests so retesting dates shouldn’t delay training adjustments at any time. Anton also reports changes in your all cause mortality risk with each test
-
Yes. If you book the DEXA/VO2max package you will have your DEXA scan performed first, followed by your VO2Max test. You can do the tests fasted or fed. To standardise future tests your pre test prep needs to be replicated.
Commonly booked by people who are
Training for a marathon, triathlon, gran fondo or Hyrox event
Over 50 and tracking cardiorespiratory fitness for longevity
Rowing, cycling or running and want zones set on their own ergometer
Returning to training after illness or a long break
Plateaued and unsure whether to train harder or easier
Referred by a GP or specialist for exercise capacity assessment
Preparing for a CASA or emergency services medical
Peri- or post-menopausal and reassessing their metabolic picture
Clinical detail
For referrers, and for anyone who wants the full picture before booking.
How CPET differs from a standard exercise test
Multi-system assessment
Integrates cardiovascular, pulmonary and muscular responses, rather than examining the heart alone via ECG.
Respiratory gas analysis
Measures oxygen uptake, carbon dioxide output and ventilatory parameters, giving insight into metabolic and ventilatory efficiency.
Individualised protocols
Workload increments are set to the individual’s capacity, producing a test duration that yields interpretable data.
Absolute contraindications
- Recent acute myocardial infarction (3–5 days)
- Unstable angina
- Uncontrolled arrhythmia causing symptoms or haemodynamic compromise
- Syncope
- Active endocarditis
- Acute myocarditis or pericarditis
- Symptomatic severe aortic stenosis
- Uncontrolled heart failure
- Suspected dissecting or leaking aortic aneurysm
- Uncontrolled asthma
- Arterial desaturation at rest on room air <85%
Relative contraindications
- Untreated left main stem coronary stenosis
- Asymptomatic severe aortic stenosis
- Severe untreated arterial hypertension at rest (>200 mmHg systolic, >120 mmHg diastolic)
- Tachyarrhythmias or bradyarrhythmias
- Hypertrophic cardiomyopathy
- Significant pulmonary hypertension
- Thrombosis of the lower extremity, until treated for a minimum of 2 weeks
- Within 2 weeks of acute symptomatic pulmonary embolus
- Abdominal aortic aneurysm >8.0 cm
- Electrolyte abnormalities
- Advanced or complicated pregnancy
All clients complete a pre-exercise health screen before testing. Where a relative contraindication is present, testing may still proceed with medical clearance and an adjusted protocol — this is assessed case by case.
How results are interpreted
Measurement is the easy part. Interpretation is where reports differ.
Matched to the test, not to a generic table
Cycle and treadmill testing produce different values in the same individual — treadmill values average 22% higher, reflecting greater recruited muscle mass. Comparing a cycle result against treadmill norms understates a client by approximately a full classification band. Results are compared against the table matching the ergometer used.
Matched to the effort achieved
Reference data is published twice, once for each definition of maximal effort. Peak respiratory exchange ratio determines which table applies, and the report states which one was used.
Current reference data
The 2022 FRIEND standards are used, drawn from 22,379 cardiopulmonary exercise tests in healthy adults aged 20 to 89. These superseded the 2015 treadmill and 2017 cycle editions, and report values 1.5 to 3.8 mL/kg/min lower — meaning older reference sets read more favourably than they should.
Thresholds are referenced, not just described
Most reports state what the aerobic threshold is. Here it is compared against 9,350 published tests by sex, age and ergometer, so the result is positioned rather than merely defined.
Sport-specific comparison where it exists
Rowers are compared against pooled data from 909 rowers by competitive class, and against absolute oxygen uptake, which is the determinant of boat speed.
Stated limits
Published reference data stops at the 90th percentile. Above that, the report states a bound rather than inventing a figure. Results falling within measurement error of a classification boundary are reported as indeterminate, on the basis that a repeat test could land either side.
Every reference used is named and cited in the report.
Cardiorespiratory fitness and mortality
Mandsager et al. (2018) followed 122,007 patients undergoing exercise treadmill testing and found cardiorespiratory fitness inversely associated with all-cause mortality, with no observed upper limit of benefit. The mortality risk attached to poor fitness was comparable to or greater than that of coronary artery disease, smoking and diabetes. The advantage of elite over high performance was most pronounced in patients aged 70 or over and in those with hypertension.
As an observational study it cannot establish causality, and the cohort was clinically referred rather than population-representative. It nonetheless makes a strong case for cardiorespiratory fitness as a modifiable marker of long-term risk, and for measuring it directly rather than estimating it.
What’s in your report ▾
Every test produces a written report and a consultation to work through it. Here is what the report contains.
Your aerobic capacity, and where it sits
Peak VO2 in both absolute and body-mass terms, your peak workload in METs, and your fitness classification against a published reference registry of healthy adults, matched to your sex, age decade and the ergometer you were tested on.
Because treadmill and cycle testing produce different values in the same person, the comparison is drawn from the table matching your test rather than a generic one.
Both of your training thresholds, with heart rates, paces and perceived effort
Your aerobic threshold and your second threshold, identified from your own gas exchange data rather than calculated from your age. Each is reported with its oxygen cost, heart rate, the pace, power or split it corresponds to, and the rating of perceived exertion you gave at that point during the test.
The perceived exertion pairing matters: a threshold you can recognise by feel is one you can train to on a day when the watch is wrong, the heart rate is drifting or the terrain has changed.
Your aerobic threshold is also ranked against published reference data by sex, age and ergometer, so you learn where it sits rather than only what it is.
Five training zones in the units you actually train in
Zones built from your measured thresholds, expressed as running pace, cycling watts, rowing split or heart rate depending on how you train. Each zone comes with what it is for and how much of your week should sit in it.
Where a zone can be expressed on more than one piece of equipment, the report gives the equivalent for each, so the same intensity transfers between the treadmill, the bike and the erg.
Fuel use at every intensity, in grams per hour
Fat and carbohydrate oxidation measured across the whole test, including the intensity at which fat use peaks and the point at which it drops away. Reported in grams per hour rather than as percentages, because that is the number a fuelling plan is built from.
For an event, this becomes a carbohydrate target per hour, set against what the gut can actually absorb and what your glycogen stores can cover.
Event pacing, where you have an event in mind
If you are training for something specific, the report works your thresholds into a target intensity for that event and converts it to pace or power. Race intensity is set by the duration of the whole event, so a run leg inside a long race is paced differently from the same distance run fresh, and the report gives both with the difference explained.
Pace targets are given as a band rather than a single number, because the conversion from oxygen cost to speed carries error and running economy varies between individuals.
Steady-state blocks: what a specific pace costs you
Alongside the ramp to exhaustion, the test can hold one or two fixed paces. The ramp answers what your ceiling is; these blocks answer whether a particular pace is one you can hold, and on what fuel.
Each block is scored over a settled window rather than from the moment the pace changed, because oxygen uptake takes around two minutes to catch up with a step in speed. Your own rating of perceived exertion is recorded against each, so you can find the pace again without a watch.
Whether the test was a valid maximal effort
Objective effort criteria are reported explicitly: peak respiratory exchange ratio, peak heart rate against prediction, and perceived exertion. You are told which criteria were met, which were marginal, and what that means for how much confidence to place in the result.
The effort achieved also determines which reference table is used, and the report states which one was applied.
Cardiac and ventilatory responses
Oxygen pulse as a surrogate for stroke volume, ventilatory efficiency, breathing reserve, peak breathing rate and tidal volume, and heart rate recovery after the test. Each is reported against a reference range with an interpretation.
Where a measure was derived from a prediction rather than measured directly, the report says so and explains what would be needed to improve it.
This is exercise assessment, not a cardiac diagnostic test. No ECG is recorded and cardiac rhythm is not commented on.
Body composition, where a DEXA scan is included
Oxygen uptake expressed per kilogram of fat-free mass as well as per kilogram of body mass. Dividing by total mass charges you for tissue that consumes very little oxygen during exercise; dividing by lean mass compares your oxygen transport against the tissue doing the work.
The report also sets out what a change in fat mass alone would do to your result, in both directions. Because oxygen uptake per kilogram has body mass in the denominator, losing fat raises the number without any change in oxygen transport, and gaining it lowers the number without any loss of fitness. Both are tabulated kilogram by kilogram, with the effect on your thresholds alongside.
Two conditions are stated with it. The gain only holds if what is lost is fat, since losing lean tissue moves the numerator down as fast as the denominator. And it matters more for running and other weight-bearing work than for cycling or rowing, where your mass is largely supported and absolute oxygen uptake is the better guide.
What a further improvement would be worth
Rather than stopping at where you are, the report projects what a given improvement would mean: the work rates it corresponds to on each piece of equipment, where it would place your thresholds, and how it compares with the alternative of carrying less fat.
Each step is also placed against the reference tables again, so you can see whether it would move your classification or only your absolute numbers.
Fitness and longevity: what each step up is associated with
Cardiorespiratory fitness is among the strongest available predictors of all-cause mortality — in large cohorts the risk attached to poor fitness is comparable to or greater than that of coronary artery disease, smoking or diabetes. Your report translates your own result into that framework.
You are given an index set at 100 for your fitness today, with the associated change for each further step up in capacity. The effect compounds rather than adds, so the index is calculated rather than estimated, and figures from both the directly measured and the larger estimated-fitness cohorts are shown side by side rather than averaged.
Where your fitness already sits in the range at which the fitness–mortality relationship flattens, the report says so, rather than implying further gains buy more survival than the evidence supports. These are associations from observational cohorts, not a personal prognosis, and the report says that too.
How you compare against younger age groups
Alongside the comparison with your own age decade, your result is set against the peak reference group — healthy adults in their twenties — and against the expected value for your age from a regression equation with survival data behind it.
This is often the more informative comparison. Aerobic capacity declines at a predictable rate per decade, so knowing whether you sit above or below the young-adult median tells you how much of that decline you have actually banked, in a way that a percentile within your own age group cannot.
Where the percentile and the equation disagree in tone, the report explains why: they answer different questions, and neither is wrong.
What to train, and when to retest
A prioritised training focus based on the relationship between your thresholds and your peak, with session formats for each quality and how often to do them. Not a generic programme, but a statement of what is actually limiting you.
Plus a recommended retest interval and what to expect to have changed by then.
Stated limits, and every reference named
Where published reference data runs out, the report states a bound rather than inventing a figure. Results falling within measurement error of a classification boundary are reported as indeterminate, because a repeat test could land either side.
Where a figure differs from the one printed by the testing equipment, the report shows both and explains why. Every reference used is named and cited, and the technical limitations of your particular test are listed at the end.
Reports are individualised, so not every section applies to every test. A sample report is available to GPs, specialists and coaches on request.
Appointments available this week. Questions first? We usually reply the same day.
or call (02) 9518 3400